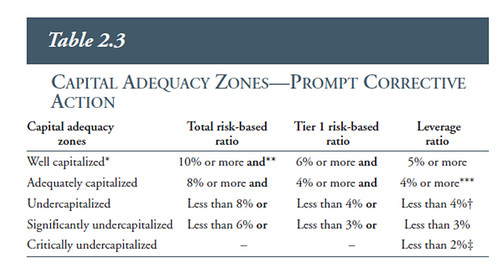
The FDIC evaluates capitalization ratios as follows:
 However, in light of the fact that many of the recently failed banks could be considered adequately capitalized, these standards are of increasingly questionable utility. Nevertheless, the relevant ratio definitions are provided below:
1. Bank equity capital- Total bank equity capital (includes preferred and common stock, surplus and undivided profits).
2. Equity capital to assets (eqv)- Total equity capital as a percent of total assets.
3. Texas Ratio (TR)- (Non-performing assets+REO)/(Equity-Intangibles-Goodwill+Loan Loss Reserves). Note: Not an FDIC ratio, but the only metric provided that accounts for non-performing assets.
4. Tier one (core) capital- Tier 1 (core) capital includes: common equity plus noncumulative perpetual preferred stock plus minority interests in consolidated subsidiaries less goodwill and other ineligible intangible assets. The amount of eligible intangibles (including mortgage servicing rights) included in core capital is limited in accordance with supervisory capital regulations.
5. Core capital (leverage) ratio (rbc1aaj)- Tier 1 (core) capital as a percent of average total assets minus ineligible intangibles.
6. Total risk-based capital ratio (rbcrwaj)- Total risk based capital as a percent of risk-weighted assets as defined by the appropriate federal regulator for prompt corrective action during that time period.
7. Tier 1 risk-based capital ratio (rbc1rwaj)- Tier 1 (core) capital as a percent of risk-weighted assets as defined by the appropriate federal regulator for prompt corrective action during that time period.
Several loan performance metrics were included, which aren't used by the FDIC to assess capital adequacy, to give a handle on the impact of loan defaults on future income and are defined as follows:
8. Noncurrent assets plus other real estate owned to assets (nperfv)- Noncurrent assets as a percent of total assets. Noncurrent assets are defined as assets that are past due 90 days or more plus assets placed in nonaccrual status plus other real estate owned (excluding direct and indirect investments in real estate).
9.Noncurrent loans to loans (nclnlsr)- Total noncurrent loans and leases, Loans and leases 90 days or more past due plus loans in nonaccrual status, as a percent of gross loans and leases.
10.Net charge-offs to loans (ntlnlsr)-Gross loan and lease financing receivable charge-offs, less gross recoveries, (annualized) as a percent of average total loans and lease financing receivables.
Maryland Bank Capitalization Data: 6/30/09 FDIC Call Report Data